Ethereum Crushes Bitcoin: Golden Cross Signals More Upside Ahead
Ethereum is crushing Bitcoin, and the golden cross on the ETH/BTC ratio says it may not be done yet. Here's what history tells us about this bullish signal.
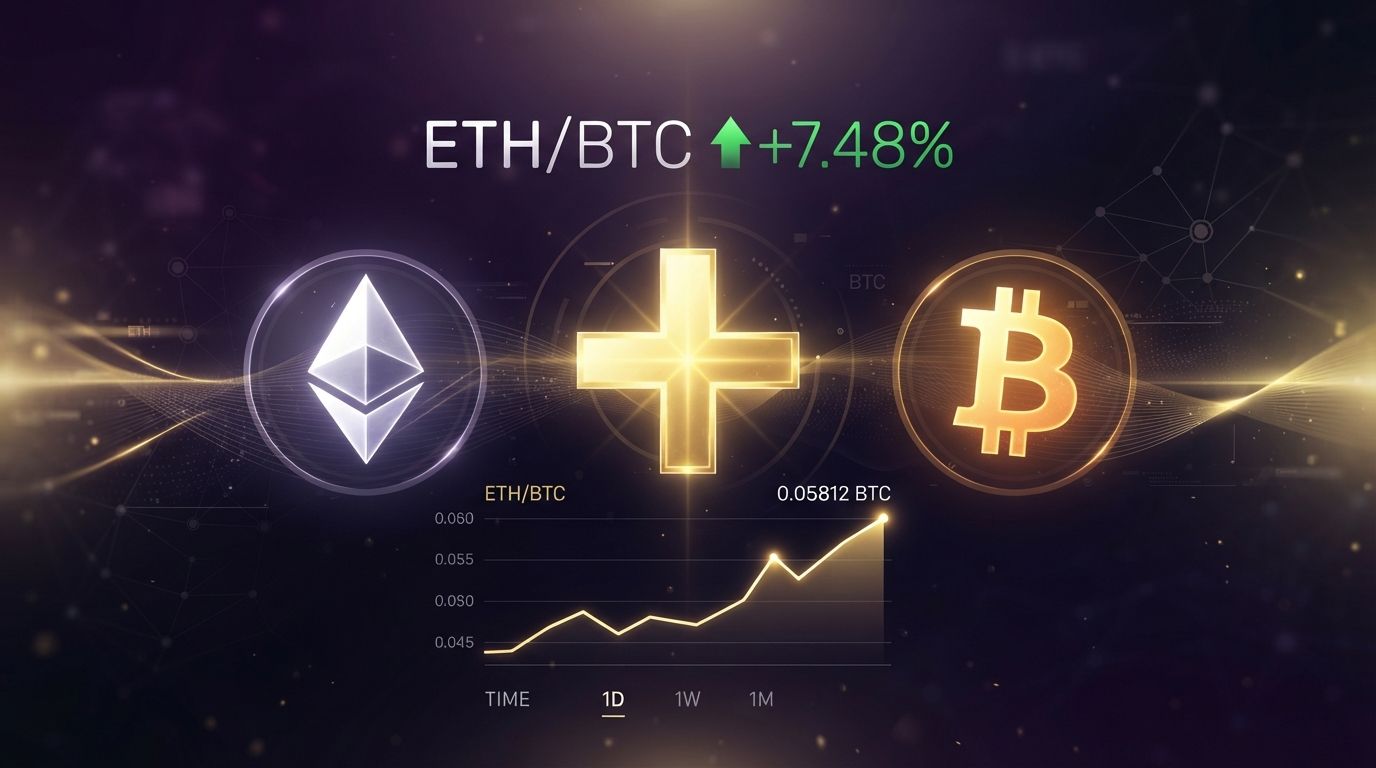
Table of Contents
- Market Overview: BTC & ETH Live Prices
- Key Takeaways
- What Is the ETH/BTC Golden Cross?
- Ethereum's 25% Run Since June
- Golden Cross History: Mixed Results
- ETH Spot ETF Inflows Outperform Bitcoin
- Market Analysis: What This Means for Traders
- Conclusion
- Create Your Own Token Today
Market Overview: BTC & ETH Live Prices
Bitcoin (BTC) is trading at:
Ethereum (ETH) is trading at:
Key Takeaways
- ETH/BTC ratio has formed a bullish golden cross (50-day MA crossing above 200-day MA)
- Ethereum has outperformed Bitcoin by approximately 25% since the June 6 bottom
- The ratio has rallied 25% from its June low, signaling sustained momentum
- ETH spot ETFs have shown stronger inflows than Bitcoin ETFs in recent months
- Historical golden crosses have had mixed results—some led to explosive rallies, others turned into bull traps
- ETH price currently at ~$2,435, up 1.2% in 24 hours with a market cap of $296.52B
- BTC price currently at ~$77,400, holding above key support levels
What Is the ETH/BTC Golden Cross?
A golden cross occurs when an asset's 50-day moving average crosses above its 200-day moving average. This technical pattern is widely watched by traders as it suggests a shift in momentum—a short-term trend gaining strength relative to the long-term trajectory.
Ether (ETH) has outperformed bitcoin
The ETH/BTC ratio has recently formed this bullish crossover, signaling that Ethereum may continue to outperform Bitcoin in the weeks ahead.
Think of the golden cross as a thermometer: it tells us the market's present temperature, not tomorrow's forecast. The logic underneath assumes that an object in motion stays in motion—if the averages are rising, momentum should persist. But that assumption doesn't always hold, which is why these signals are not always reliable.
Ethereum's 25% Run Since June
Ethereum has been on a remarkable run since early June. The ETH/BTC ratio has climbed approximately 25% from its June 6 low, marking one of the strongest periods of ETH outperformance against BTC in recent memory.
Key drivers of ETH's outperformance:
- Strong ETF inflows – Ethereum spot ETFs have been attracting more capital than their Bitcoin counterparts
- Staking demand – Growing institutional interest in ETH staking yields
- Technical breakout – ETH broke through resistance at $2,371 that had capped it since June
- Rotational trade – Capital rotating from Bitcoin into Ethereum as traders seek higher beta exposure
The golden cross formation adds technical confirmation to what has already been a strong fundamental trend.
Golden Cross History: Mixed Results
Golden crosses on the ETH/BTC ratio have a checkered history. Some have delivered explosive gains; others have trapped bulls on the wrong side of the market.
Notable Golden Crosses:
| Date | Outcome |
|---|---|
| February 2021 | Fueled a 93% rally that took the ratio to 0.0824 by mid-May 2021 |
| July 2025 | Initially delivered a 36% rally over four weeks, then reversed into a steep downtrend |
| May 2022 | Bull trap – ratio fell almost immediately after formation |
| August 2022 | Bull trap – another false signal |
Earlier golden crosses have been even more spectacular:
- 2020 golden cross preceded Ethereum's climb to all-time highs, with ETH/BTC gaining ~120% in six months
- The 2020 setup ultimately led to 250% outperformance against Bitcoin in the following year
The mixed historical record underscores an important point: past performance does not guarantee future results. While the current golden cross is bullish, traders should remain cautious and watch for confirmation signals.
ETH Spot ETF Inflows Outperform Bitcoin
One of the strongest fundamental tailwinds for Ethereum has been the performance of ETH spot ETFs. In recent months, Ethereum ETFs have attracted stronger inflows than their Bitcoin counterparts.
What this means:
- Institutional demand for ETH is accelerating
- ETH is benefiting from rotational flows as investors diversify beyond Bitcoin
- Staking yields add an extra layer of appeal for ETH holders
The ETF flow dynamic is a key metric to watch as it provides real-time insight into institutional positioning.
Market Analysis: What This Means for Traders
Bullish signals:
✅ Golden cross formation on ETH/BTC
✅ 25% rally from June lows
✅ Strong ETF inflows into ETH products
✅ ETH breaking key resistance levels
Risks to consider:
Golden crosses have produced false signals in the past (May 2022, August 2022)
The July 2025 golden cross reversed sharply after an initial rally
Technical signals are not forward-looking—they reflect past price action
Key levels to watch:
- ETH/BTC support – Previous resistance turned support near current levels
- BTC price – If Bitcoin breaks below $75K, it could drag ETH lower
- ETF flows – Continued inflows would support further upside
Conclusion
Ethereum is crushing Bitcoin, and the golden cross on the ETH/BTC ratio suggests the trend may have more room to run. The ratio has rallied 25% since June, supported by strong ETF inflows, institutional adoption, and a bullish technical setup.
However, history reminds us that golden crosses are not foolproof. Some have led to spectacular rallies; others have been bull traps. The key for traders is to watch for confirmation—sustained ETF inflows, breaking key resistance levels, and broader market sentiment.
Key takeaways:
- ETH/BTC golden cross signals potential for continued outperformance
- ETH up 25% since June 6 low
- ETH ETFs attracting stronger inflows than BTC ETFs
- Historical golden crosses have had mixed results
- ETH at ~$2,435, BTC at ~$77,400
Create Your Own Token Today
Inspired by Ethereum's ecosystem growth? Whether you're building on Solana or EVM-compatible chains, launching your own token has never been easier.
For Solana Token Creation – Visit solsmint.com to mint your token for just 0.05 SOL. No coding skills required—simply connect your wallet and deploy your project in minutes.
For EVM Chains (Ethereum, BNB Chain, Base, Polygon, and more) – Head to etokenlab.com for advanced, multi-chain token creation with zero coding required.
Start your blockchain journey today! Whether you're launching a meme coin, utility token, or governance token, our platforms provide the easiest way to bring your vision to life.
Disclaimer: This article is for informational purposes only and does not constitute financial advice. Cryptocurrency markets are volatile and carry significant risk. Always conduct your own research before making investment decisions.
Continue reading
- Big Banks Strike Deal to Move to Solana Blockchain
- SOL Institutional Holdings: Total Holdings at 11.739M SOL, 2.04% of Current Total Supply
- Solana (SOL) Price News: Outperforms BTC, Poised to Follow Ether’s 200% Rally
How to trade the ETH/BTC golden cross without overreacting
A golden cross is a momentum signal, not a forecast. It confirms that the recent trend is stronger than the long-term average, which matters because it changes the odds for the days ahead rather than guaranteeing a specific target. Treat it as a reason to review positioning, not to bet the portfolio.
The three things that make this golden cross different
- Spot ETF inflows: sustained net creation into Ethereum products adds a structural buyer that did not exist in earlier cycles.
- Relative valuation: the ETH/BTC ratio was depressed for a long stretch, so the move higher starts from a low base.
- Rotation dynamics: capital rotating from Bitcoin into other large caps tends to favour the highest-liquidity alternatives first.
What could invalidate the signal
Golden crosses have failed before. A sharp macro risk-off move, a reversal in ETF flows, or a decisive close back below the 200-day average would all argue that the crossover was a bull trap. The signal is only as good as the levels it holds.
| Scenario | Trigger | Likely ETH/BTC path |
|---|---|---|
| Continuation | Sustained ETF inflows | Slow grind higher |
| Chop | Mixed macro data | Range-bound |
| Invalidation | Loss of the 200-day average | Retest of prior lows |
FAQ: ETH/BTC golden cross
Does a golden cross guarantee a rally? No. Historical crosses have produced both strong rallies and bull traps.
Should I rotate out of Bitcoin? Only within limits you set in advance, and only if your thesis supports it.
Where can I build instead of trade? Launch a token cheaply with the Solana token creator and let the market judge the idea.
Bottom line on the golden cross
The ETH/BTC golden cross is a meaningful shift in relative momentum, supported this time by ETF inflows and a low starting valuation. It is still a probabilistic signal, and probabilities are only useful when your position size allows you to be wrong.
Whatever the ratio does next, the cost of creating your own project keeps falling. Use the no-code Solana token creator to build while the market debates the chart.
Disclaimer: This article is for information and education only and is not financial, investment, or tax advice. Crypto assets are volatile and you can lose money. Always verify token authorities and contract details yourself before interacting with any asset.

About Solsmint
Solsmint publishes hands-on guides about Solana, SPL tokens, DeFi, and NFTs based on direct use of the tools described. Every article names its author and dates, and corrections are reviewed after a request via our contact page. Read more about our editorial approach.
Last updated: